Bridging the Semantic Gap: Agentless Runtime Detection via Hypervisor Traps
A reference architecture for monitoring agent-hostile VMs using LibVMI and Wazuh.
The Hook
What if I told you that you can monitor every process, syscall, and memory allocation inside a running VM, without installing a single byte of software on it?
No agent, no driver, no kernel module. The VM doesn't even know it's being watched.
That's not a research toy. It's a real, mature technique called Virtual Machine Introspection (VMI), and it solves a problem most security teams quietly live with. VMs that can't host an EDR/XDR agent because they don't have the resources to spare.
This post is the architecture I've been working through as a personal research topic, the reasoning, the design, the exact toolchain, and what the alerts look like when wired into Wazuh. It's not a from-zero installation guide for a laptop, it's the reference design you'd hand to a platform team to actually deploy.
If you've ever stared at a 2/4-core production VM that your XDR vendor won't install on, this one's for you.
The Real World Problem
Here's the setup. Your org has XDR deployed broadly, call it CrowdStrike, SentinelOne, Defender for Endpoint, whatever. Most of the fleet, covered.
Then there's the long tail:
A legacy ETL box that has run on 2/4 vCPUs and 4 GB RAM since 2018 because no one wants to touch it.
An appliance VM where the vendor explicitly forbids third-party agents.
A performance-sensitive trading or telephony gateway that can't afford a 5% CPU steal.
A bunch of small VMs in a cost-optimised tier where doubling the CPU just to fit an agent isn't justifiable.
Skipping them creates a monitoring gap. And monitoring gaps are exactly what pentesters and auditors love finding.
When you bring this up internally, the conversation goes:
"Just install the agent."
"It needs more resources than the VM has."
"Then resize the VM."
"Application team won't approve. There's a change freeze."
"Get an exception."
"Exception requires a compensatory control."
And that's where most teams get stuck. What does a compensatory control even look like for a VM you can't touch?
Why The Obvious Approaches Don't Work
Before going down the VMI path, I worked through the alternatives, and rejected each of them for honest reasons.
| Approach | Why I rejected it |
|---|---|
| Install a "lite" agent | Vendors love marketing this. In practice, "lite" still means 300–500 MB RAM and ~1 cores. Not lite enough. |
| Syslog forwarding only | Captures auth events, misses process/memory/kernel telemetry. Not enough for MITRE-aligned detection. |
| Network-only monitoring (NDR) | Sees north-south traffic. Blind to lateral movement and in-host activity. |
| Periodic agentless scans | Point-in-time. A runtime attack that runs for 12 minutes between scans is invisible. |
| Just accept the risk | The honest answer most orgs land on. But it's not a control, it's a gap with paperwork. |
I wanted something architecturally different — something that worked with the constraint rather than around it.
Enter Hypervisor Introspection
Here's the core idea in plain English.
Your VMs don't actually own their own memory or CPU. The hypervisor does - Xen, KVM, ESXi, whatever runs underneath. When a VM thinks it's reading address 0xffff8800_12345678, the hypervisor is the one that translates that to a real location in the host's RAM.
The hypervisor sees everything. That's not a bug. It's the entire point of virtualization. The hypervisor needs total control to do its job.
VMI takes advantage of this. A privileged sibling (or the hypervisor host itself) can ask the hypervisor: "Hey, show me what's in VM-B's memory right now." The hypervisor reads it directly from host RAM and hands it over. VM-B is never asked, never notified, never involved.
It gets better. Modern CPUs (Intel VT-x, AMD-V) have hardware features that make this efficient:
Extended Page Tables (EPT) - the hypervisor can mark guest memory pages as non-executable. When the guest tries to execute that page, the CPU itself raises a hardware exception and pauses the guest. The hypervisor then inspects what's going on and resumes the VM. Microsecond-scale.
vCPU register access - the hypervisor can read every CPU register of any VM at any time, including
CR3(which tells you which process is currently scheduled).VM exits (VMEXIT) - a hardware mechanism that lets the hypervisor get notified on specific events: syscalls, MSR writes, interrupts.
Wire this up properly and you get a monitoring system that:
Has zero overhead inside the guest, no process, no memory, no CPU consumed in the VM
Is tamper-resistant, malware inside the guest cannot detect or disable it
Can see things in-guest agents cannot, like processes hidden via DKOM (Direct Kernel Object Manipulation)
This is exactly what we want for those 2-core VMs.
A Note On Why This Is A Reference Design
Before going further: I want to be upfront. This post is the reference architecture and toolchain, not a screenshot-driven walkthrough of me running it end-to-end on my laptop.
I tried building the full stack on my MacBook (M-series, Apple Silicon) using UTM with nested KVM. Apple Silicon does not expose hardware virtualization extensions to guests there's no nested /dev/kvm. You can fall back to QEMU TCG (software emulation), but that path loses the EPT-based event interception that makes DRAKVUF interesting. The LibVMI memory-read primitives still work in TCG, but it's not a representative demo.
The right place to validate this is on a real x86 hypervisor, either a bare-metal box (Hetzner dedicated, AWS c5.metal, etc.) or an internal lab host.

The non-obvious things to call out:
Guests are untouched. No agent, no kernel module, no config change. They run normally.
The collector talks to the hypervisor, not the guest. There's no network channel between the collector and the guests. The "communication" is the hypervisor reading host RAM on the collector's behalf via privileged APIs (
libxcon Xen,/dev/kvmioctls on KVMI-patched KVM).The Wazuh SIEM is a separate, larger VM. It does all the heavy lifting, indexing, alerting, dashboards. The collector just forwards.
The collector concentrates a lot of privilege. If it's compromised, every guest on the host is exposed. We'll come back to this in the limitations section.
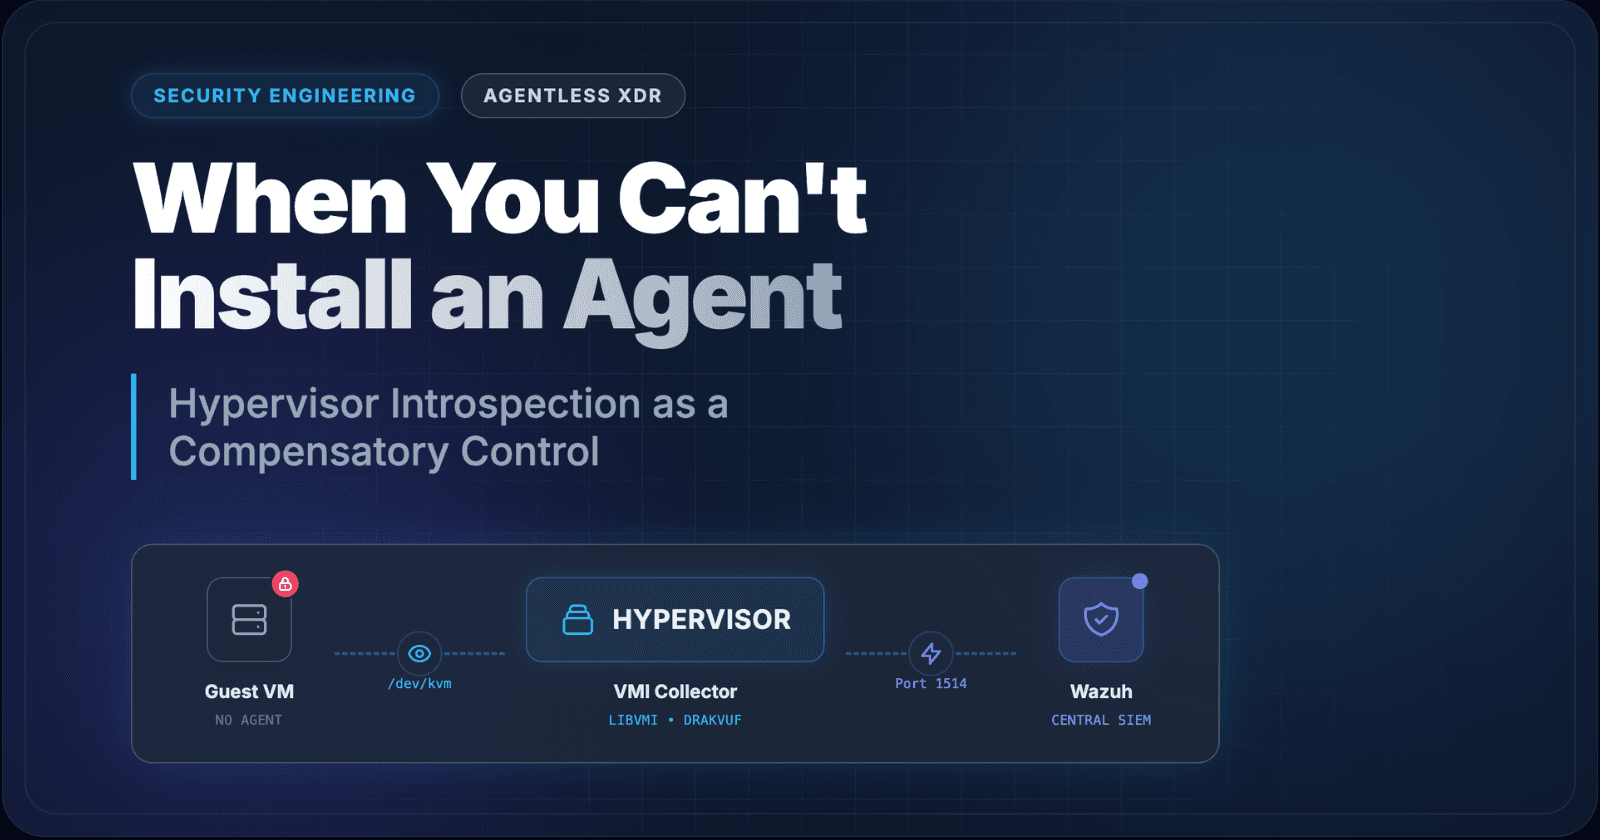
What You Deploy, And Where
This is the part most articles gloss over. Three distinct components, three different deployment locations.
On the Guest VMs (the 2-core boxes you're protecting)
Nothing. That's the entire point. No agent, no driver, no Wazuh sensor, no config change. The monitoring exists entirely outside them.
On the VMI Collector (one privileged VM per hypervisor host)
Sized around 2 vCPU and 4 GB RAM as a baseline, scaling up with the number of monitored guests. Install:
| Component | Purpose |
|---|---|
| LibVMI | C library that reads guest memory and accesses vCPU state via the hypervisor |
| DRAKVUF | Builds on LibVMI provides syscall, process, file, network, and memory event plugins via EPT traps |
| Python telemetry bridge | Reads DRAKVUF JSON, normalises to Wazuh event format, applies severity and MITRE mapping |
| Wazuh agent (forward-only mode) | Ships events to the central Wazuh manager |
| Guest OS profiles | Kernel struct offsets so LibVMI can interpret guest memory |
This VM needs hypervisor-level privileges: it must be Xen Dom0, or a Linux host running KVM with the KVMI kernel patch, or a privileged sibling configured with the right capabilities.
On the Wazuh Server (one central VM for the whole env)
Size at 4–8 vCPU, 16+ GB RAM. Install:
| Component | Purpose |
|---|---|
| Wazuh manager | Receives events, applies decoders and detection rules |
| Wazuh indexer (OpenSearch) | Stores telemetry, powers search |
| Wazuh dashboard | UI for analysts |
| Custom VMI decoders | Parse the bridge's JSON event format |
| Custom VMI rules | MITRE-tagged detections for VMI-specific event types |
The Tools - What Each One Does
A quick map so the next section makes sense.
LibVMI is the foundational library. It speaks to Xen or KVMI, reads guest memory, walks page tables, and bridges the "semantic gap" between raw bytes and OS-level concepts like processes and modules. It's a C library with Python bindings. On its own, it gives you primitives like
vmi-process-list,vmi-module-list, and the ability to write your own introspection programs.DRAKVUF sits on top of LibVMI. It uses EPT/altp2m features to set hardware breakpoints on syscalls and other interesting events, and exposes them through a clean plugin interface (
syscalls,procmon,filemon,regmon,netmon,memmon). Output is structured JSON. Built originally for malware analysis but ideal for production telemetry.The Python telemetry bridge is just a test code (you can generate it using Claude or Cursor according to your logic). It reads DRAKVUF's JSON stream, normalises events to Wazuh's expected format, applies rate limiting and severity, attaches MITRE ATT&CK tags, and forwards via the Wazuh socket.
Wazuh is the central SIEM. We use it because it's open-source, has decent detection rules out of the box, supports custom decoders, and integrates well with OpenSearch dashboards.
Installing the Collector
This is the prescriptive recipe for a real x86 hypervisor host running KVM with the KVMI patch. Adjust paths for Xen if that's your stack.
Prerequisites
You need a Linux host that:
Is running on bare metal (or a cloud instance with hardware virtualization passed through)
Has Intel VT-x or AMD-V enabled in BIOS (
grep -E "vmx|svm" /proc/cpuinforeturns hits)Is running a KVMI-patched kernel (stock kernels won't expose
/dev/kvmmem)Has root access
# Confirm KVMI is available

ls /dev/kvmmem && echo "KVMI present" || echo "KVMI MISSING - need patched kernel"
If /dev/kvmmem doesn't exist, you'll need to either build a KVMI-patched kernel (search the Bitdefender HVI / KVMI patch series), or switch to Xen which has VMI support in the mainline tree.
Install dependencies
sudo apt update
sudo apt install -y \
    build-essential git autoconf libtool pkg-config \
    flex bison libglib2.0-dev libjson-c-dev \
    libfuse-dev libsystemd-dev liblzma-dev \
    libvirt-dev libvirt-daemon-system libvirt-clients \
    qemu-kvm python3-pip
Build LibVMI from source
cd /opt
sudo git clone [https://github.com/libvmi/libvmi](https://github.com/libvmi/libvmi)
cd libvmi
sudo autoreconf -vif
sudo ./configure --enable-kvm
sudo make -j$(nproc)
sudo make install
sudo ldconfig

# Verify
vmi-process-list --help
Install DRAKVUF
DRAKVUF is more involved to build from source. The maintainer (Tklengyel) provides Debian packages:
echo "deb [https://pkg.drakvuf.com/debian](https://pkg.drakvuf.com/debian) bookworm main" | \
  sudo tee /etc/apt/sources.list.d/drakvuf.list
curl -fsSL [https://pkg.drakvuf.com/debian/key.gpg](https://pkg.drakvuf.com/debian/key.gpg) | \
  sudo gpg --dearmor -o /etc/apt/keyrings/drakvuf.gpg
sudo apt update
sudo apt install -y drakvuf
Configure LibVMI for your guests
LibVMI needs to know each guest's OS type and where to find kernel symbols. For each Linux guest VM you want to monitor, add an entry to /etc/libvmi.conf:
linux-etl-prod-01 {
    ostype = "Linux";
    sysmap = "/etc/libvmi/profiles/linux-etl-prod-01-System.map";
}

linux-appliance-02 {
    ostype = "Linux";
    sysmap = "/etc/libvmi/profiles/linux-appliance-02-System.map";
}
For Linux guests, extract the System.map from each guest's /boot/ (it's typically named System.map-<kernel_version>) and stash it on the collector. This file gives LibVMI the kernel symbol offsets it needs to walk structures like task_struct, mm_struct, and files_struct. A quick way to grab it from a running Linux guest:
# From the hypervisor host, copy the System.map out of the guest
GUEST_IP=
KERNEL=\((ssh user@\)GUEST_IP uname -r)
scp user@\(GUEST_IP:/boot/System.map-\)KERNEL \
    /etc/libvmi/profiles/linux-etl-prod-01-System.map
Kernel updates inside the guest will shift these offsets. Refreshing the System.map should be part of your guest patch runbook.
The Python Telemetry Bridge
This is the test code. It consumes DRAKVUF JSON and forwards to Wazuh. Save as /opt/vmi-bridge/vmi_bridge.py:
#!/usr/bin/env python3
"""
VMI Telemetry Bridge
Reads DRAKVUF JSON event stream, normalises to Wazuh format, forwards via Wazuh socket.
"""
import json
import socket
import subprocess
import threading
import queue
import time
import logging
from datetime import datetime
from typing import Optional

logging.basicConfig(level=logging.INFO, format='%(asctime)s %(levelname)s %(message)s')
log = logging.getLogger("vmi-bridge")

# ─── Configuration ────────────────────────────────────────────────────────────
WAZUH_SOCKET = "/var/ossec/queue/sockets/queue"
DOMAIN_ID = "linux-etl-prod-01"
DRAKVUF_PLUGINS = ["syscalls", "procmon", "filemon", "socketmon", "memmon"]
MAX_QUEUE = 10_000
BATCH_SIZE = 50
FLUSH_SECS = 2

# ─── Severity + MITRE mapping (Linux syscalls) ────────────────────────────────
SEVERITY_MAP = {
    "openat": "low",
    "execve": "high",
    "execveat": "high",
    "ptrace": "high",
    "process_vm_writev": "critical",
    "mprotect": "medium",
    "mmap": "low",
    "init_module": "critical",
    "finit_module": "critical",
    "delete_module": "critical",
    "kexec_load": "critical",
    "setuid": "medium",
    "setgid": "medium",
}

MITRE_MAP = {
    "execve": ("T1059", "Command and Scripting Interpreter"),
    "execveat": ("T1059", "Command and Scripting Interpreter"),
    "ptrace": ("T1055", "Process Injection"),
    "process_vm_writev": ("T1055", "Process Injection"),
    "mprotect": ("T1055.009", "Proc Memory"),
    "init_module": ("T1547.006", "Kernel Modules and Extensions"),
    "finit_module": ("T1547.006", "Kernel Modules and Extensions"),
    "kexec_load": ("T1542.003", "Bootkit"),
    "setuid": ("T1548.001", "Setuid and Setgid"),
}

SEVERITY_TO_LEVEL = {
    "informational": 3,
    "low": 5,
    "medium": 7,
    "high": 10,
    "critical": 13
}

class Normalizer:
    def normalize(self, raw: dict) -> Optional[dict]:
        try:
            plugin = raw.get("Plugin", "unknown").lower()
            method = raw.get("Method", "")
            severity = SEVERITY_MAP.get(method, "informational")
            mitre = MITRE_MAP.get(method, (None, None))

            event = {
                "timestamp": raw.get("TimeStamp", datetime.utcnow().isoformat()),
                "rule": {
                    "level": SEVERITY_TO_LEVEL[severity],
                    "description": f"VMI: {plugin} - {method}",
                    "groups": ["vmi", "hypervisor_introspection", plugin],
                },
                "agent": {"name": f"vmi-{DOMAIN_ID}", "type": "libvmi"},
                "data": {"vmi": {
                    "plugin": plugin,
                    "method": method,
                    "pid": raw.get("PID", 0),
                    "ppid": raw.get("PPID", 0),
                    "process": raw.get("ProcessName", "unknown"),
                    "vcpu": raw.get("VCPU", 0),
                    "args": raw.get("Args", {}),
                    "guest_vm": DOMAIN_ID,
                }},
            }

            if mitre[0]:
                event["rule"]["mitre"] = {
                    "id": [mitre[0]],
                    "tactic": ["Defense Evasion"],
                    "technique": [mitre[1]],
                }
            return event
        except Exception as e:
            log.error(f"normalize: {e}")
            return None

class WazuhForwarder:
    def __init__(self, path):
        self.path = path
        self.sock = socket.socket(socket.AF_UNIX, socket.SOCK_DGRAM)

    def send(self, events):
        for ev in events:
            payload = f"1:vmi-bridge:{json.dumps(ev)}"
            try:
                self.sock.sendto(payload.encode(), self.path)
            except Exception as e:
                log.error(f"send: {e}")

class DRAKVUFCollector:
    def __init__(self, domain, q):
        self.domain = domain
        self.queue = q
        self.norm = Normalizer()

    def start(self):
        plugins = " ".join(f"-x {p}" for p in DRAKVUF_PLUGINS)
        cmd = f"drakvuf -d {self.domain} -o json {plugins}"
        proc = subprocess.Popen(cmd.split(), stdout=subprocess.PIPE, stderr=subprocess.DEVNULL, text=True)

        for line in proc.stdout:
            line = line.strip()
            if not line:
                continue
            try:
                raw = json.loads(line)
                ev = self.norm.normalize(raw)
                if ev and not self.queue.full():
                    self.queue.put_nowait(ev)
            except json.JSONDecodeError:
                continue

def flusher(q, fwd):
    while True:
        batch = []
        deadline = time.time() + FLUSH_SECS
        while time.time() < deadline and len(batch) < BATCH_SIZE:
            try:
                batch.append(q.get(timeout=0.1))
            except queue.Empty:
                break
        if batch:
            fwd.send(batch)
            log.info(f"sent {len(batch)}")

def main():
    q = queue.Queue(maxsize=MAX_QUEUE)
    fwd = WazuhForwarder(WAZUH_SOCKET)
    threading.Thread(target=flusher, args=(q, fwd), daemon=True).start()
    DRAKVUFCollector(DOMAIN_ID, q).start()

if __name__ == "__main__":
    main()
Wrap it in a systemd unit at /etc/systemd/system/vmi-bridge.service:
[Unit]
Description=VMI Telemetry Bridge
After=network.target wazuh-agent.service

[Service]
Type=simple
ExecStart=/usr/bin/python3 /opt/vmi-bridge/vmi_bridge.py
Restart=on-failure
User=root

[Install]
WantedBy=multi-user.target
Enable and start:
sudo systemctl daemon-reload
sudo systemctl enable --now vmi-bridge
sudo journalctl -u vmi-bridge -f
Setting Up Wazuh
Single-node install on the central Wazuh VM:
curl -sO [https://packages.wazuh.com/4.7/wazuh-install.sh](https://packages.wazuh.com/4.7/wazuh-install.sh)
sudo bash ./wazuh-install.sh -a
This installs the manager, indexer, and dashboard. At the end it prints the admin password save it. Dashboard is at https://<YOUR_IP>:443.
Custom decoder /var/ossec/etc/decoders/vmi_decoder.xml:
<decoder name="vmi-bridge">
  <plugin_decoder>JSON_Decoder</plugin_decoder>
</decoder>
Custom rules /var/ossec/etc/rules/vmi_rules.xml:
| Decoder | Match / Method | Arguments / Targets | Description | MITRE ATT&CK ID |
|---|---|---|---|---|
vmi-bridge |
process_vm_writev, ptrace |
— | VMI: Possible process injection on $(data.vmi.guest_vm) |
T1055 (Process Injection) |
vmi-bridge |
execve, execveat |
bash, sh |
VMI: Shell execution detected on $(data.vmi.guest_vm) |
T1059.004 (Unix Shell) |
vmi-bridge |
hidden_process_detected |
— | VMI: Hidden process — possible rootkit on $(data.vmi.guest_vm) |
T1014 (Rootkit) |
vmi-bridge |
init_module, finit_module |
— | VMI: Kernel module load on \((data.vmi.guest_vm) by \)(data.vmi.process) |
T1547.006 (Kernel Modules and Extensions) |
vmi-bridge |
mprotect |
PROT_EXEC.*PROT_WRITE, PROT_WRITE.*PROT_EXEC |
VMI: RWX memory region created on $(data.vmi.guest_vm) — possible in-memory payload |
T1620 (Reflective Code Loading) |
vmi-bridge |
setuid |
— | VMI: setuid call on \((data.vmi.guest_vm) by \)(data.vmi.process) |
T1548.001 (Setuid and Setgid) |
Restart the manager so the new rules load:
sudo systemctl restart wazuh-manager
sudo /var/ossec/bin/wazuh-logtest # Paste a sample event to verify the decoder fires
What The Alerts Look Like
The bridge produces events that fit Wazuh's analytics model natively. Four example events worth showing in your dashboard.
Example 1 - Suspicious shell spawn (rule 100101)
A web service that should never spawn a shell suddenly does. Classic post-exploitation indicator.
{
  "timestamp": "2026-06-21T14:23:17.412Z",
  "rule": {
    "level": 10,
    "description": "VMI: Suspicious process bash on linux-etl-prod-01",
    "groups": ["vmi", "hypervisor_introspection", "syscalls"],
    "mitre": {
      "id": ["T1059.004"],
      "tactic": ["Execution"],
      "technique": ["Unix Shell"]
    }
  },
  "data": {
    "vmi": {
      "guest_vm": "linux-etl-prod-01",
      "plugin": "syscalls",
      "method": "execve",
      "process": "bash",
      "ppid": 1842,
      "ppname": "nginx",
      "args": {"argv": ["bash", "-c", "id; uname -a"]}
    }
  }
}
The interesting field here is ppname: nginx. A web server spawning bash is not normal and because VMI sees the parent-child relationship from outside, you catch this even if an attacker has cleared bash history or unhooked auditd inside the guest.
Example 2 - Process injection via ptrace (rule 100100)
A non-debugger process calling ptrace(PTRACE_ATTACH) against another process is one of the loudest signals on Linux. Almost no legitimate userland software does this.
{
  "timestamp": "2026-06-21T14:24:03.819Z",
  "rule": {
    "level": 13,
    "description": "VMI: Possible process injection on linux-etl-prod-01",
    "mitre": {
      "id": ["T1055"],
      "technique": ["Process Injection"]
    }
  },
  "data": {
    "vmi": {
      "guest_vm": "linux-etl-prod-01",
      "plugin": "syscalls",
      "method": "ptrace",
      "process": "evil",
      "pid": 4928,
      "args": {
        "request": "PTRACE_POKETEXT",
        "target_pid": 1,
        "target_process": "systemd"
      }
    }
  }
}
Process injection into PID 1 (systemd) is the kind of thing only malware does. The fact that this fires regardless of any in-guest detection being disabled is the point of VMI.
Example 3 - Kernel module load by an unexpected binary (rule 100103)
LKM-based rootkits are still a thing on Linux. They load via init_module or finit_module — both observable from the hypervisor.
{
  "timestamp": "2026-06-21T14:25:11.224Z",
  "rule": {
    "level": 13,
    "description": "VMI: Kernel module load on linux-appliance-02 by unknown_binary",
    "mitre": {
      "id": ["T1547.006"],
      "technique": ["Kernel Modules and Extensions"]
    }
  },
  "data": {
    "vmi": {
      "guest_vm": "linux-appliance-02",
      "plugin": "syscalls",
      "method": "finit_module",
      "process": "unknown_binary",
      "pid": 6611,
      "uid": 0,
      "args": {"module_name": "diamorphine", "flags": 0}
    }
  }
}
diamorphine is a well-known open-source rootkit used in research and red-team work. Watching for its module name is a cheap quick-win detection. Far more important — any module load that didn't come from your config-management agent or kernel-update process is worth investigating.
Example 4 - Hidden process / DKOM signal (rule 100102)
{
  "timestamp": "2026-06-21T14:25:51.003Z",
  "rule": {
    "level": 15,
    "description": "VMI: Hidden process — possible rootkit on linux-etl-prod-01",
    "mitre": {"id": ["T1014"]}
  },
  "data": {
    "vmi": {
      "guest_vm": "linux-etl-prod-01",
      "plugin": "procmon",
      "method": "hidden_process_detected",
      "process": "kworker_xmr",
      "pid": 8423,
      "note": "Found by walking task_struct list, but not visible via /proc enumeration inside guest"
    }
  }
}
That last one is the unique value of VMI compared to in-guest EDR. An attacker who owns the kernel can hide from any agent running in user-space or even kernel-space inside the VM for example by unlinking their process from the task_struct list seen by /proc. They cannot hide from the hypervisor, because the hypervisor doesn't ask the OS it reads raw memory and reconstructs the truth from the real kernel data structures.
In Wazuh's dashboard, these show up as MITRE-tagged alerts with full pivot, correlation, and timeline support. From there you wire them into your existing SOC workflow Slack/PagerDuty/Jira/whatever.
The Honest Limitations
If I were reviewing this design as a security architect, here's what I'd push back on. I'm putting it in the blog so you can push back on yourself before you pitch it.
Hypervisor lock-in. This works on Xen and KVM-with-KVMI. It does not work on VMware ESXi (you'd need their partner introspection APIs and a partner-licensed product) or Hyper-V (no equivalent at all). If your org is mostly VMware, this isn't your control.
KVMI is not in the mainline kernel. It's been proposed for years. As of 2026 it still requires patching your kernel or running a specific distro. This is operational pain you need to plan for.
The collector concentrates massive privilege. It has hypervisor-level access to every guest. If it's compromised, every monitored VM is compromised. Treat it like a domain controller — strict network segmentation, MFA, audit logging, no general-purpose workloads.
The semantic gap is real maintenance. Kernel updates can shift struct offsets. LibVMI needs OS profiles. When your guests get patched, you may need to refresh their
System.mapfiles on the collector. Plan for this in your runbook — tie it to your existing patch cycle.Evasion is possible. Sophisticated malware can detect a hypervisor's presence via timing attacks, CPUID fingerprinting, or specific MSR reads. VMI is not invisible to malware that actively looks for it. It is invisible to the vast majority of malware that doesn't.
No user-space-only visibility. If an attacker's entire payload runs in user-space and never makes a syscall or touches a monitored page, VMI sees nothing. This is rare in practice (almost everything touches a syscall eventually), but worth stating.
Performance overhead. Each EPT trap is a VMEXIT, which costs 1000–5000 CPU cycles. Trap on too many things and you'll slow the guest measurably. Tuning the trap set matters — you don't want to monitor every syscall, just the high-signal ones.
Production Considerations
If after all that you're still interested in piloting this:
Start with one host, two guests. Validate the whole pipeline end-to-end before scaling.
Build OS profiles for every distro/version you run. Make this part of your patching playbook.
Size the collector at ~1 vCPU per 5 monitored guests + 4 GB RAM baseline. Adjust based on your workload's syscall frequency.
Harden the collector aggressively. Read-only root filesystem where possible, no SSH except from a bastion, full audit of every LibVMI/DRAKVUF API call.
Document this as a compensatory control with your auditor up front. "We monitor these VMs from the hypervisor layer via VM introspection, producing telemetry equivalent to host-based EDR for process, memory, and syscall events, with the architectural property that the monitored VM cannot detect or disable the monitoring." That's the sentence.
Tune Wazuh aggressively. Out of the box, monitoring 20 VMs will drown you in low-severity events. Filter at source, batch, deduplicate.
Wrap-Up
VMI isn't a silver bullet, and I'm not suggesting anyone rip out their XDR. What it is, is the only architecturally clean answer I've found to a problem most orgs quietly tolerate the long tail of VMs that can't host an agent.
The thing I keep coming back to: the hypervisor already has total visibility into every VM. Not using it for security is leaving capability on the floor.
My next step is to get this running on a real x86 hypervisor lab and validate the full pipeline end-to-end including a follow-up post with actual screenshots, real attack simulations (process injection, DKOM rootkit, in-memory dropper), and performance numbers.
If your org has the right infrastructure and you want to compare notes, I'd love to hear from you. If you have similar agentless gaps in your fleet, I'd love to hear how you're handling them. Drop a comment or find me on the usual places.
Further reading:
LibVMI: https://libvmi.com
DRAKVUF: https://drakvuf.com
Garfinkel & Rosenblum (2003) - "A Virtual Machine Introspection Based Architecture for Intrusion Detection" - the paper that started it all
Lengyel et al. (2014) - "Scalability, Fidelity and Stealth in the DRAKVUF Dynamic Malware Analysis System" - ACSAC